Which is the maximum speed at which an aircraft fly? Well, it is defined at the time of
manufacturing only. We will see how to obtain maximum speed of aircraft at the maximum
lift with the help of V-n diagram. It is a very important diagram, and every aircraft
has its own V-n diagram. We will first derive the formula for angular velocity
and radius required for a turning flight.


Case 1. A-LEVEL TURN FLIGHT
As u can see in the figure

A
Φ Is
bank angle
L is lift
R is radius
W is weight
From figure
Components figure will be made

B
We can say from the figure
A plane is at a constant altitude and horizontal plane
We will now introduce a new term “load
factor”
n=L/W…1
The load factor is usually quoted in
terms of “g’s”; for example, an aeroplane with lift equal to 10 times the weight
is said to be experiencing a load factor of 10 g’s.
Hence, the equation can be written as,
From newton’s law of motion

Combining 2 and 3

The angular velocity is denoted by w=V∞/R
called a turn rate.
For both the civil aircraft and jet aircraft we
required, The highest possible load factor, The lowest possible velocity.
Case 2. PULL – UP MANOEUVRE

In this case the initially L=W then there is a sudden increase
in the lift, L>W Airplane will begin to
turn upwards in the vertical plane.
The resultant force is, from figure

Combine equation 6 and 3
Case3. PULL-UP MANEUVER.

In this case, initially L=W, suddenly flight rolls to invert
position in such a manner Land W both are in downwards direction as shown in
figure

Cobine 9 and 3 equations
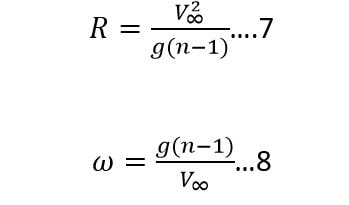
High-performance aircraft are designed in such a way that they have high load
factor and low turn radius,n+1 ≅ n and n-1 ≅ n, the equation will be reduced to

We know that lift is
Substituting equation 14 and 1 into 12 and
13

From the above Equation, it clearly shows that lower the wing
loading smaller the turn radius and larger the turn rate everything else is
constant
Designing of the wing loading is done by the following
points
V-n DIAGRAM
At high speed, n is limited because of structural designed. V-n
Diagram is a graph of load factor versus velocity of a given aircraft

The plane is at velocity V1 and at an angle of attack
where Cl<Clmax, is point 1 in the diagram. Velocity
remains the same V1, angle of attack is increased to get max lift
and max load factor that can be obtained at velocity V1 is point 2
in the diagram.
With the same velocity, we will again increase the angle of attack,
wing stalls and load factor drops at point 3, it is called a stall region, is
unobtained in flight.
Now, we will increase the velocity to V4 and
max possible load factor also increases, is the point is 4.
Beyond a certain value
of load factor, defined as the positive limit load factor and showed by
the horizontal line in the diagram. Velocity corresponding to point B is V*. We
will again increase the velocity to V5, is the velocity where we fly
at Cl<Clmax, so that +limit load factor is not exceeding. Point 5
is a point where we get clmax at velocity V5 with
structural damage in aircraft.
Vertical line CD is the high-speed limit, the velocity
greater than this, the dynamic pressure becomes so large that again structure
damage may occur to the aeroplane. AE&ED they are negative absolute angles
of attack that is a negative load factor
Point B is called a manoeuvre point. At this point lift and
load factor both simultaneously at the highest possible values, velocity
corresponding to pint B is called the corner velocity V*

No comments:
Post a Comment